0330 332 7866
 advise-me@fosterdenovo.com
 Search
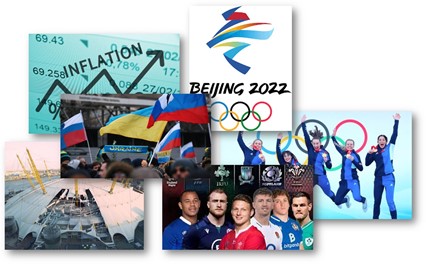
Market Briefing (no.43) – 22nd February 2022
On the sporting front, the Beijing 2022 Winter Olympics have just finished with Great Britain’s medal success not as hoped pre-games, returning with one gold and one silver in the Curling.
Returning to Europe, the annual northern hemisphere rugby festival – the Six Nations – reaches its mid-way point this weekend with all teams except Italy still in with a chance of lifting the trophy. France are the only nation who can win the Grand Slam which, if they win the championship or get the clean sweep, will be the first time either event has happened for them since 2010.
On a more serious front, the Ukraine-Russia crisis remains balanced between a possible Russian invasion and long term stalemate as Putin continues to press the opinion that the West wishes to encircle Russia with pro-NATO states. Putin has increased the tension by recognising Luhansk and Donetsk, followed by troop movements into these two self-declared breakaway regions in Eastern Ukraine. The West remains convinced of a full scale invasion; whether these troop movements constitute this, events over the next few days will tell. In response, equity markets have fallen sharply due to this uncertainty and the prospects of a broader major conflict in mainland Europe.
When combined with the impact of rising energy prices – caused in part by the geopolitical crisis between the two former Soviet republics – together with global labour shortages, inflation sits at its highest level for decades. All of which has impacted global economies, causing stormy markets during the last few months. And with the UK in the middle of its third named weather storm in a week (Dudley, Eunice and Franklin) – the first time this has happened – and markets unsettled, what should long-term investors be thinking about?
“The individual investor should act consistently as an investor and not as a speculator.” — Ben Graham
British-born American economist Benjamin Graham was a professor and professional investor. He graduated from Columbia University, New York, USA at age 20.
He is also known for employing his former student Warren Buffett before he took up teaching positions back at Columbia University, and later at the Anderson School of Management at the University of California, Los Angeles (UCLA), USA. He had many well-known followers including the aforementioned Warren Buffett, who after reading Graham’s book ‘The Intelligent Investor’ said “if I hadn’t read that book in 1949, I’d have had a different future.” (1)
As Graham said, long term investors should not be speculators. To do this requires patience combined with level headed thinking to avoid emotional reactions to short-term market movements. But it is only natural for long-term investors to be unsettled when their investments fall, especially over a short period of time.
“In the short run, the market is a voting machine, but in the long run, it is a weighing machine.” — Ben Graham
Emotions or reactions to current events may influence short-term equity prices. However, these will pass and give way to the fundamentals of the underlying companies in the long term. Quality will prevail despite the bumpy short lived turbulence. Remaining calm, resolute and avoiding some of the obvious biases is key.
To gain further reassurance, peering into historic market falls and drawing reasonable conclusions may help. Let’s consider some examples.
2001/02: ‘Dotcom’ burst bubble

The ‘dotcom’ bubble was a speedy rise in investments of internet based companies during the late 1990s which resulted in a swift rise in U.S. technology stocks. Things began to change in 2000 with the bubble bursting between 2001 and 2002 and as graph 1 shows (left) resulted in a bear market in 2002.
Clearly the falls in graph 1 for both 100% equity markets, as shown by the blue line, and a sector comprised of funds investing across broader asset types, including equities, (i.e. multi-asset funds), as shown by the red line, are not pleasant viewing. However, how should a long-term investor view this market fall? A consideration of a longer, more appropriate time frame provides some essential context which the long-term investor should be very mindful of.
Viewing the same global equity market (blue line) and the same multi-asset sector (red line) for the longest period data is available (i.e. since 29.12.89), graph 2 (right) shows the black oval displaying the impact over the period.

In reality, a blot on the overall landscape. And even for the most ‘glass half empty’ person, the market had fully recovered by mid to late 2003, well within a short-term investing time period of 5 years.
2008/09: the Great Financial Crash
 In the main, the Great Financial Crash that took place between 2008 and 2009 was caused by poor decision-making, risk taking and greed, predominantly facilitated through mortgage-backed securities created from US subprime residential mortgages.
Heavily invested in these securities, Lehman Brothers announced bankruptcy on 15th September 2008, and on the following day, 16th September 2008, the world’s largest insurance company, AIG (American International Group), also announced it was going bankrupt. This resulted in many investment funds that owned that stock collapsing, taking much of the market down.

Economies across the globe pumped £billions into their economies and central banks. They conducted asset purchases via massive quantitative easing programmes(3) to reassure investors, in an attempt to end any recession and avoid the global economy slipping into a 1930s style depression.
As can be seen by graph 3 (right) the same global equity market (blue line) and the same multi- asset sector (red line) fell over 20% during the 5 months between May and October of 2008.
But as you will note, towards the end of this period, the recovery had begun. But what was the long- term impact?
 Graph 4 shows the longest period that data is available which is just over 32 years. The pink oval shows the Great Financial Crash (the same period covered in graph 3).
When reviewed over this 32 year time period, it puts the pink oval period into context; it’s just another blot on the landscape.
2020: The Covid-19 pandemic
It’s hard to believe it’s nearly two years since the world started going into what became known as ‘lockdown’ caused by the Covid-19 coronavirus pandemic.
As graph 5 shows stock markets began to fall during the end of February 2020, finalising their drop by the end of March 2020.
In the main, the crash was fuelled by significant falls in oil prices and global investor fears about the coronavirus spread and its impact on economic life.

But what does the Covid-19 induced market fall over the 32 year period we’ve been reviewing look like?
The green oval in graph 6 shows a steep decline for the end of February and into March 2020, counterbalanced very quickly by a return to strong growth.
Once again, it can be seen that there was no significant detrimental impact on the long-term landscape.

But what about recent weeks?
The last few weeks
As graph 7 shows (below), it’s clear from the last few weeks of 2021 on in to this year, that markets have fallen up to 5%.
The recent falls began just before Christmas and have continued, on and off, until now.

Clearly these falls are not pleasant and can understandably provoke strong emotional feelings.
But what about now? What should be the reaction of long term investors?
The orange ovals in graph 8 do show a steep decline for the blue equities line with the red multi-asset line declining not so much.
But we clearly do not know what will happen in the near term.

How should investors react?
Any action driven by understandable strong emotions is highly likely to be detrimental to investors’ long-term objectives as the examples in the above graphs clearly illustrate.
What should this tell you?
Without claiming that the dotcom bubble in 2001-02, the Great Financial Crash of 2008-09, the pandemic commencement in 2020 or the current situations are similar events, and not wishing to underestimate the anxiety potentially caused by such events, investors should try and remember Ben Graham’s wise counsel; that is, behave as long-term investors rather than short-term speculators.
Irrespective of short-term market falls and remembering that “past performance is no guide to future returns”, from an investment perspective, investors should have a balanced, longer term view.
As we have said many times before, we will continue to monitor current financial situations and keep you notified of any significant changes that are made. Please contact your Foster Denovo Partner if you wish to discuss your financial situation further.
This week in history…
22nd February 1797: The Last Invasion of Britain, launched by the French during the Revolutionary Wars, begins near Fishguard, Wales (4)
23rd February 1991: US President George H. W. Bush gives Iraq a 24-hour deadline to withdraw from Kuwait or face a ground war (4)
24th February 1983: Dow Jones closes above 1100 mark for 1st time (4)
25th February 1969: Beatles begin recording Abbey Road album (4)
26th February 1797: Bank of England issues first £1 note (4)
27th February 1998: Britain’s House of Lords agrees to end 1,000 years of male precedence by giving a monarch’s first-born daughter the same claim to the throne as any first born son (4)
28th February 1975: Train crash at Moorgate station kills 43 people and injures a further 74 (4)
1st March 1946: British government nationalises and takes control of the Bank of England, after 252 years (4)
1st March 1947: International Monetary Fund begins operation (4)
Sources
- https://aaronschnoor.medium.com/the-man-who-mentored-warren-buffett-a57ad1242590
- Financial Express Fundinfo
- Quantitative easing (QE) is a form of monetary policy used by central banks as a method of quickly increasing the domestic money supply and spurring economic activity. Quantitative easing usually involves a country’s central bank purchasing longer-term government bonds, as well as other types of assets, such as mortgage-backed securities – https://investopedia.com/terms/q/quantitative-easing.asp
- https://onthisday.com