0330 332 7866
 advise-me@fosterdenovo.com
 Search
Market Briefing (no.47) – 11th July 2022
Following heavy criticism for initially denying that he was made aware of allegations of inappropriate behaviour against Chris Pincher in 2019, Boris Johnson has resigned as Conservative Party leader.
Despite being aware of the allegations. Johnson promoted Pincher to the post of Deputy Chief Whip in February this year.
His resignation followed dozens of Tory MPs – including many Ministers – resigning from his Government. He will resign as Prime Minister once a new leader has been elected.
The leadership campaign has begun in earnest, with, as at the time of writing, 11 declared candidates. This will likely increase during the next few days.
The current timetable is that the new leader is likely to be installed before the Tory party conference.
Rising inflation – what should you be thinking?
Inflation is a measure of the rate at which a range of prices are rising over time. For example, if a bar of chocolate costs £1 one year and £1.09 the next year, then that’s an annual inflation rate of 9%.
The Bank of England has warned inflation might reach 11% within months, as the prices of fuel, energy and food, place further pressure on household budgets.
In the UK, the Office for National Statistics (ONS) calculates inflation. They record the prices of hundreds of everyday items; this is known as the ‘basket of goods’.
This basket is constantly updated. In 2022, reflecting a rising interest in plant-based diets and exercise items, tinned beans and sports bras were added. The ONS releases its inflation figures each month, showing how much these prices have risen since the same date last year. This is known as the Consumer Prices Index (CPI).
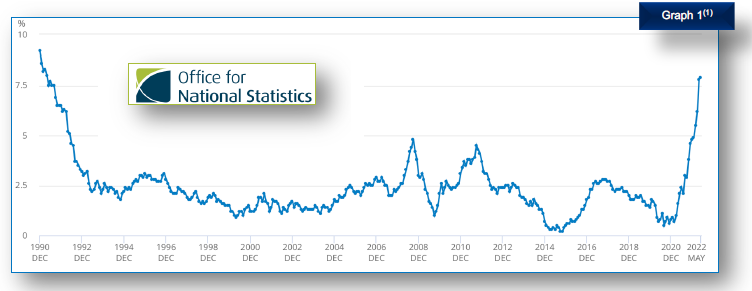
As graph 1 shows, in their latest notification, the ONS confirmed that the CPI – incorporating what is known as CPIH(2) which includes housing costs – rose by 7.9% to May 2022, up from 7.8% in April. The headline year on year CPI figure rose to 9.1% in May up from 9.0% the previous month.
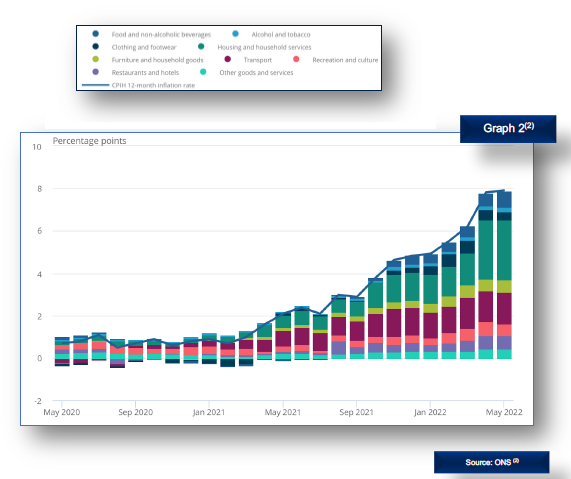
The largest contributions to the upwards direction in May 2022 came from housing and household services; 2.79%, mainly from electricity, gas and other fuels. The Ofgem energy price caps limit the price energy suppliers can charge the estimated 15 million households that either use a prepayment meter or are on the ‘standard variable’ energy tariff. They currently update the energy price caps twice a year (April and October).
Ofgem said, ‘Prepayment customers will see an increase of £708 from £1,309 to £2,017. The increase is driven by a record rise in global gas prices over the last six months, with wholesale prices quadrupling in the last year’.
These rises resulted in 12-month inflation rates of a staggering 53.5% for electricity and 95.5% for gas in April. The ‘good news’ is that these are unchanged in May(3).
In addition to gas and electricity, the continued sanctions on Russia for the war in Ukraine has seen oil prices increase materially impacting petrol and diesel prices. The increase in price has been felt more this year as we emerge from lockdown and are back to near pre-covid travel. In addition, oil is priced in the US dollar which has strengthened since the start of the year further increasing the pound sterling equivalent price.
Average petrol prices stood at £1.659 per litre in May 2022 – the highest price recorded – compared with £1.272 per litre a year earlier. Diesel was at £1.797 per litre, also the highest on record. This all resulted in the 12-month inflation rate for motor fuels being 32.8%; the highest since before the current format of records began in January 1989.(3)
Second-hand cars have been a contributor as well. The increase from April 2021 came when there were reports of increased demand, caused by a global semiconductor shortage which impacted the production time of new cars, pushing drivers to buy second hand cars.
There were also concerns in the second hand car market that fewer one-year-old cars were becoming available. This was because of a fall in new car registrations a year earlier, in part caused by drivers extending the leases on their cars and less part exchanges as new car deliveries were delayed for the semiconductor reasons above(3).
However, with all of the above occurring, context is important. Although some of the inflation increases are eye- watering, it’s important to know that the CPIH(2) mentioned above only increased by 0.1% from April to May, i.e., 7.8% increase from April 2021 to April 2022, increased to 7.9% for May 2021 to May 2022 (3).
What’s the impact on investing?
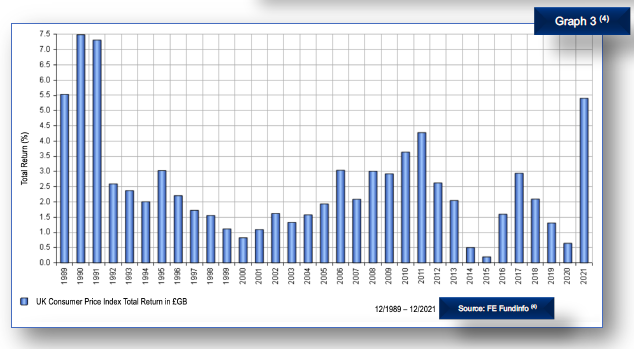
Although it doesn’t include data for 2022 (as it only shows full calendar years), graph 3 is a bar chart version of graph 1 above.
Whilst not including this year, graph 3 shows the annual CPI percentage for the longest period of time that FE Fundinfo can supply, to the end of 2021. As can be seen, 2021’s CPI percentage is at the highest point for 30 years since 1991 which has continued on into 2022.
So the question that needs to be answered is what impact has higher inflation had on investing historically?
Graph 4 shows the same blue columned annual inflation data for the same time period. The graph also shows the Bank of England base rate (grey columns), a major UK stock market investing 100% in shares (the pink columns) and a major UK multi-asset (5) sector (the orange columns) for each calendar year.
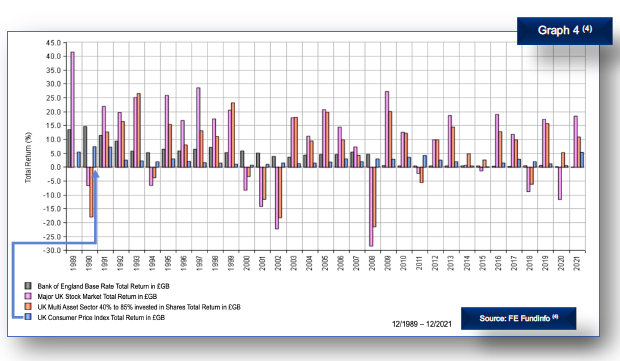
As can be seen the blue column showing inflation is in the main dwarfed by the columns for both the UK stock market and the multi- asset sector.
What does this mean? In 24 of the last 33 years since 1989, the UK major stock market and UK major multi-asset sector was significantly higher than any inflation percentage that impacted the economy in the same year. So what could this mean for investors?
As graph 5 shows, in particular the blue inflation line (D), based on the annual percentage of CPI over the 33 years being considered, £1,000 would be ‘worth’ £2,155.43; in other words you would need £2,155.43 in 2021 to buy goods that were worth £1,000 at the end of 1989.
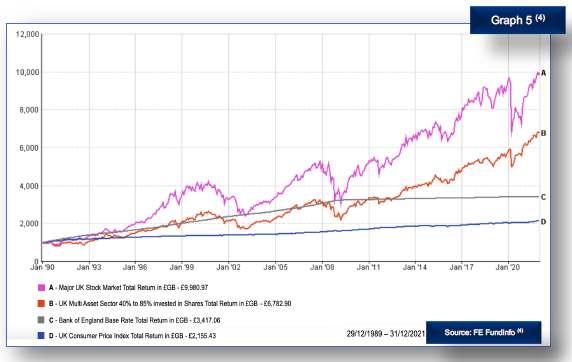
However, if an investor had invested the same £1,000 in a broad based multi-asset fund in 1989, it would be worth £6,782.90; over 3 times the rate of inflation (line B). And if another investor had invested in a major UK stock market, the £1,000 would be worth £9,980.97; over 4.5 times the rate of inflation (line A).
What should this tell you?
It is normal to get preoccupied by the current spate of news headlines when inflation is at record highs impacting investment portfolios, causing them to fall in value in the short term. However, as we have seen above, being preoccupied with short-term financial events can lead to unnecessary anxiety as, although past performance is no guide to future returns, over the medium to long-term equity and multi asset portfolios have significantly managed long term inflation attacks very effectively.
As we have said many times before, we will continue to monitor the current financial situation and keep you notified of any significant changes that are made. Please contact your Foster Denovo Partner if you wish to discuss your financial situation further.
Sources
- https://ons.gov.uk/economy/inflationandpriceindices/timeseries/l55o/mm23
- CPIH is the most comprehensive measure of inflation. It extends CPI to include a measure of the costs associated with owning, maintaining and living in one’s own home, known as owner occupiers’ housing costs (OOH), along with council tax. This dataset provides CPIH time series (2005 to latest published month), allowing users to customise their own selection, view or download – https://ons.gov.uk/datasets/cpih01/editions/time-series/versions/23
- https://ons.gov.uk/economy/inflationandpriceindices/bulletins/consumerpriceinflation/may2022
- Financial Express Fundinfo
- A multi-asset class, also known as a multiple-asset class or multi-asset fund, is a combination of asset classes (such as cash, equity or bonds) used as an investment. A multi-asset class investment contains more than one asset class, thus creating a group or portfolio of assets – https://investopedia.com/terms/m/multiasset_class.asp
- https://onthisday.com
Key Indicators
The ‘Key Indicators’ shown in the table to the left are designed to provide an overview analysis of different asset types, different geographical jurisdictions and industrial sectors.
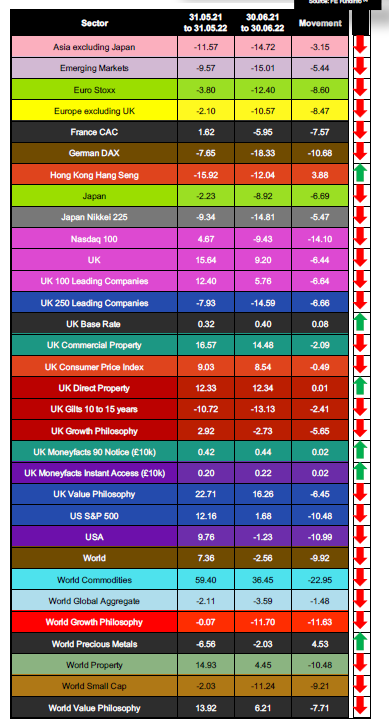
They also include statistics that show the changes in inflation, property – both residential and commercial – together with how UK base interest rate and ‘high street’ interest rates change.
The comparison period is over 1 year and compares the difference on a monthly basis over that 1 year period.
For example, this first version compares the statistics for all key indicators between 31st May 2021 and 31st May 2022 against 30th June 2021 and 30th June 2022 (the most up to date data available). Every quarter the key indicators will also include data that is published quarterly in arrears, for example UK Gross Domestic Product (GDP) and unemployment figures for the UK and where available overseas geographical jurisdictions.
The source of this data unless stated otherwise is FE Fundinfo (4).
IMPORTANT INFORMATION
This publication is marketing material. It is for information purposes only. This statement is for the sole use of the recipient to whom it has been directly delivered by their Foster Denovo Partner and should not be reproduced, copied or made available to others. The information presented herein is for illustrative purposes only and does not provide sufficient information on which to make an informed investment decision.
This document is not intended and should not be construed as an offer, solicitation or recommendation to buy or sell any specific investments or participate in any investment (or other) strategy. Potential investors will have sought advice concerning the suitability of any investment from their Foster Denovo Partner. Potential investors should be aware that past performance is not an indication of future performance and the value of investments and the income derived from them may fluctuate and they may not receive back the amount they originally invested. The tax treatment of investments depends on each investor’s individual circumstances and is subject to changes in tax legislation.