Search
Market Briefing 53 22nd May 2023
23.05.2023Market Briefing 53
Whatever your personal or political views on the monarchy, the recent coronation was the first day of its kind for over 70 years.
What we now know is the United Kingdom monarchy has a very complex ‘origin story’ with King Charles III the most recent in a long line of United Kingdom monarchs.
This long line commenced in England with King Egbert in 827 (1) and Scotland with King Keneth in 834 (2).
Then in 1272 Edward I became the first king of Britain (England & Wales) (1), ratified by the 1536 Act of Union with Henry VIII as monarch.
1601 saw the then James VI of Scotland become James I of Britain, thereby becoming the first king of Great Britain (England & Wales and Scotland) (1).
Then in 1801, following the act of union between the kingdoms of Great Britain and Ireland, George III – who had been king of Great Britain since 1760 – became the first king to claim the crown of the United Kingdom.
And finally, in 1949 when the Irish Free State became the Republic of Ireland – 13 years after his accession in 1936 – George VI became the first monarch of the United Kingdom of Great Britain and Northern Ireland.
With Saturday 6th May 2023 being a historic day in these islands’ history and the first of its type in over 7 decades, assuming the monarchy constitutionally continues, the 21st Century will likely see another 2, possibly 3, similar days.
What will these be like? Will previous occasions be an indicator? Time will tell, but can historic events be used as predictors of future events, such as investment performance?
‘Past performance is not a reliable indicator of future results’
You will likely have seen the above words every time you read an investment article or fund factsheet…“Past performance is not a reliable indicator of future results.” Yet many investors still base their decisions on how well or poorly something has done in the past.
So is this phrase simply a warning that perhaps doesn’t always apply, or is it something that should be taken more seriously?
In other words, is the past actually a reliable indicator of future performance?
It is fair to say that past returns shouldn’t be ignored completely. They can be a useful tool when analysing funds. They can be used to judge whether investment performance has been the result of luck or skill. They can show whether a fund manager has delivered their returns using an appropriate level of investment risk. And they can also show how performance has varied during different periods in the economic cycle.
While investment past performance can provide some information into a fund’s potential, as the FCA warns, it is not a reliable indicator of future returns. Why does the FCA – and us – say this?
The warning also contains a second meaning. Investments shouldn’t be discounted simply because they’ve performed poorly recently; it could improve. There are likely more reasons but in the main there are three reasons why past performance is not a reliable indicator to future returns:
Past performance data is incomplete or unreliable
Particularly for newer or more complex investment products, past performance is likely to be at best meaningless and at worse totally misleading. Without a comprehensive and accurate set of data, it is very difficult to draw meaningful conclusions about an investment’s future performance based solely on past results.
Market conditions change constantly
Factors such as geopolitical events, economic cycles, and changes in investor opinion and sentiment can have a significant impact on investment returns. Just because something worked successfully before, it doesn’t mean it will perform as well in the future due to changing market conditions and circumstances.
Investment strategies evolve
Investment managers may alter their strategies based on changing market conditions, more up to date information and even regulatory and tax changes. This means that past performance may not accurately reflect the investment style used in the future.
When it comes to investing in funds, looking at past performance data is very appealing and is the starting point for many. The temptation for many is to select funds based on past performance data because it is easy to understand – unlike much of the other financial criteria and research available to help.
Patience in long-term investing is essential but is counter intuitive in today’s challenging constant news and data cycle.
Some investors may intellectually believe they are long-term investors but look at their investments via their online account or platform daily.
It can, therefore, seem quite ‘old fashioned’ watching a multi-asset portfolio through a full market cycle.
This impatience is also heightened by the ‘fear of missing out’, i.e., looking at other investments and concluding ‘I’d have been better off over there.’
Unfortunately, the saying goes that people ‘avoid pain far more than they seek pleasure’, so when the information suggests pain – i.e., returns are lower than hoped – this can lead to impatience and the desire to do something in the short term about it intensifies.
All the behavioural points discussed above regarding how investors should feel are all well and good, but amid apparent poor performance against other investments, the words are easy to say but more difficult to accept. Some evidence of what the numbers show would help; ironically of course, the numbers below will be past performance and so will not be reliable indicators of future returns either!
Table 1
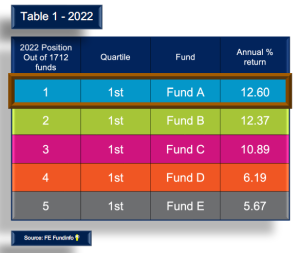
Table 1 shows the top five performing multi asset (5) funds for 2022 across the three main Investment Association (IA) sectors (6).
The performance is reflected as a percentage return for the calendar year of 2022.
The total number of funds included was 1,712 with the funds cited here being in their relevant position, i.e., number 1, 2, etc.
The table also includes a column entitled ‘Quartile’ (7). As the label suggests this refers to quarters or 25%. So, the 1st – or top – quartile in table 1 refers to the first ¼ or 25% of the 1,712 funds, i.e., a fund is in the top 428 of the 1,712 included.
Bringing this all together, Fund A is number 1 and 1st quartile out of 1,712 funds in terms of percentage return for the calendar year 2022 with 12.60%. For context – and not shown here – the lowest performing fund in the calendar year 2022 had a negative return with -25.12%.
So, considering table 1, how should we interpret the phrase in question, i.e., past performance is not a reliable indicator of future results?’
Table 2
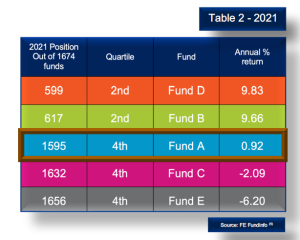
Table 2 shows the same five funds with their calendar performance for 2021.
Using Fund A as the example again, table 2 shows that in 2021, the fund had a return of 0.92%.
The analysis for that year showed that it was positioned 1,595th out of 1,674 funds – 79 funds from the bottom – resulting in a fourth quartile location.
For context, the lowest performing fund in 2021 had a negative return of -43.15%.
More broadly when comparing 2021 with 2022, none of the funds were top quartile, with a further two being fourth quartile.
Important note:
The time period examined in Tables 1 and 2 above, and Tables 3 through 6 below, only cover the 5-year period between 2018 and 2022. The timeframe of 5 years is only being used for analysis purposes. Drawing meaningful outcomes from data over such a short timeframe results in potentially misleading conclusions. The purpose of this data is to evidence that no meaningful conclusions should be drawn from past performance data no matter the timeframe, and shorter timeframes will likely lead to even more misleading conclusions.
Table 3
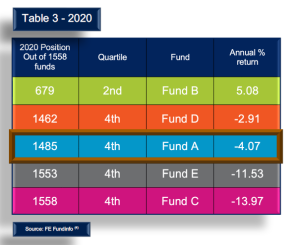
Moving back to 2020, table 3 shows the same five funds with their calendar performance for that year.
Again using Fund A as the example, table 3 shows that in 2020, the fund had a negative return of -4.07%.
It was positioned 1,485th out of 1,558 funds – 73 funds from the bottom – resulting in a fourth quartile location.
For context, the lowest performing fund in 2021 had a negative return of -43.15%.
More broadly when comparing 2021 with 2022, as can be seen, none of the funds were top quartile.
Table 4
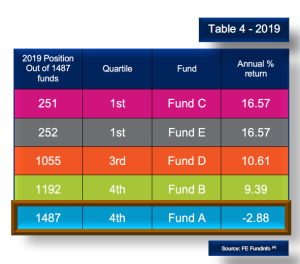
Table 4 steps back one more year to 2019.
Continuing to use Fund A, table 4 shows that in 2019, the fund had a negative return of -2.88%.
For context, this fund was the lowest performing fund in the 2019 calendar year.
Fund A was positioned 1,487th out of 1,487 funds – the absolute last place – resulting in a fourth quartile location.
Table 5
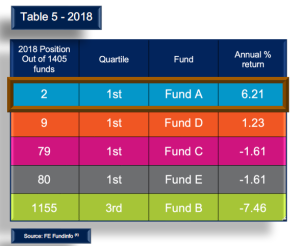
Table 5 goes back to 2018 and shows that the fund had a return of 6.21% in 2018.
It was positioned 2nd out of 1,405 funds resulting in a top quartile location.
For context, the lowest performing fund in the 2019 calendar year returned a negative of -16.32%
Table 6
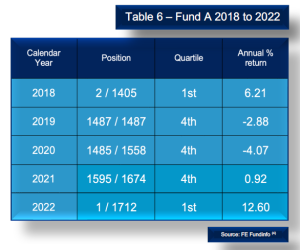
Finally, table 6 collates the data for Fund A for the period 2018 to 2022; it should be remembered that the same conclusions could be drawn for Funds B through E as well.
If an investor had based their decision to invest on past performance in 2018 – a reasonable assumption due to the fund positioned 2nd – the following three years would have been dreadful, with 2022 showing a recovery to 1st. The total return for these five years would have been 12.78%, averaging 2.56% per year.
This clearly evidences that past performance is certainly not a reliable indicator of future returns.
What should this tell you?
As conclusively shown above, a top-performing fund over a one-year period is not likely to be the same over a five-year period because investment performance can be volatile and subject to a range of factors that can change over time. There is also a well evidenced factor at work, mean reversion which means that higher past returns are more likely to go back to their longer-term mean, or average, than remain higher for longer.
In the short-term, investment returns can be influenced by factors such as market sentiment, economic conditions, and geopolitical events. As evidenced above, a fund that performs well over a one-year period may have benefited from a favourable market environment, which may not persist over a longer time frame. Similarly, a fund that underperformed over a one-year period may have been negatively impacted by temporary factors that may not affect its performance over a longer period.
Over a longer timeframe, investment performance tends to be influenced by more fundamental factors such as the quality of the investment team, the consistency of the investment approach, and the ability to adapt to changing market conditions. These factors are typically more indicative of a fund’s long-term potential and are less likely to be influenced by short-term market volatility.
Additionally, investors may have different investment objectives over different time horizons. For example, an investor with a shorter time horizon may be more concerned with generating returns in the near term, while an investor with a longer time horizon may be more focused on achieving steady, consistent returns over time. This can lead to different investment strategies and different funds being favoured over different time horizons.
Investment performance can be volatile and subject to a range of factors that can change over time. While a fund may perform well over a one-year period, this is not necessarily indicative of its long-term potential. Investors should consider a range of factors when evaluating investment opportunities and should take a long-term perspective when making investment decisions.
So, although tempting to use a mental shortcut of history, it’s important to remember that ‘past performance is not a reliable indicator of future results’, no matter what statistics and marketing organisations’ research and present to investors.
It is also important to remember that investors generally should have longer-term investment time horizons than the 2 to 3 years covered above. In addition, the above data reviews only five funds. The principles drawn will apply to all funds no matter what their investment strategy, style or philosophy. Investors should likely be smarter and broader regarding their investment diversification. This could include a wide spread of geographical areas, asset types, styles and philosophies.
As we have said many times before, we will continue to monitor the current financial situation and keep you notified of any significant changes that are made. Please contact your Foster Denovo Partner if you wish to discuss your financial situation further. At times like these, it is even more important that you are taking advice on your finances by a qualified and experienced financial planner. If you think any of your friends, family or colleagues would benefit from speaking to us, especially in the current situation, then please introduce them to your Foster Denovo Partner who would be happy to help.
Key indicators up to 30th April 2023
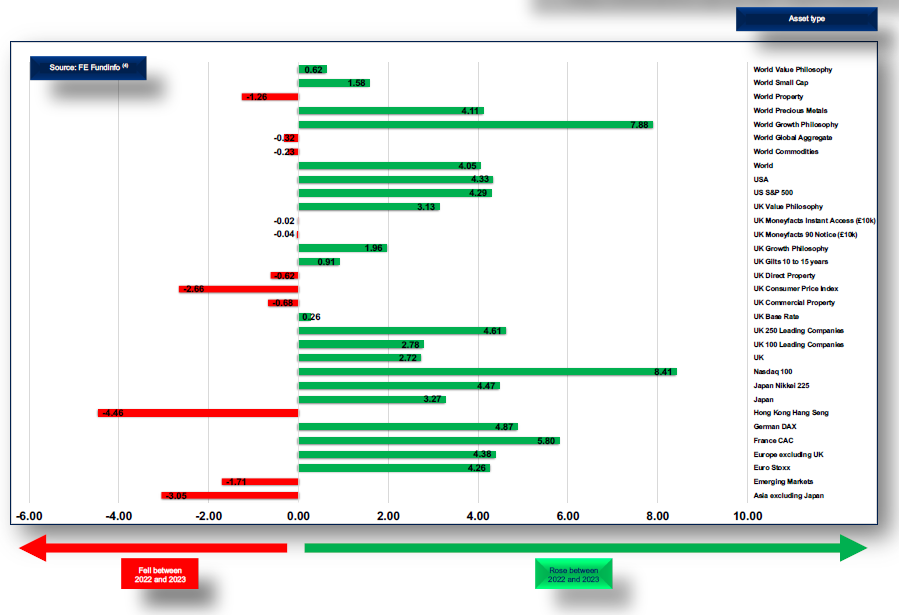
The ‘Key indicators’ shown in the chart above are designed to provide an overview analysis of different asset types, different geographical jurisdictions, and industrial sectors.
The comparison period compares the difference over two 12-month periods. This version compares all key indicators between 31st March 2022 and 31st March 2023, against 30th April 2022 and 30th April 2023. For example, the first entry, World Value Philosophy, rose (by 0.62%) in this 12 months compared.
They also include statistics that show the changes in inflation, property – both residential and commercial – together with how UK base interest rate and ‘high street’ interest rates change.
The source of this data is FE Fundinfo.
Sources
- https://www.historic-uk.com/HistoryUK/KingsQueensofBritain/#:~:text=There%20have%20been%2062%20monarchs,period%20of%20approximately%201200%20years
- https://bitaboutbritain.com/monarchs-of-scotland-843-1603/
- https://www.handbook.fca.org.uk/handbook/COBS/4/5A.pdf
- FE Fundinfo
- Multi-asset funds are ‘a multi-asset class, also known as a multiple-asset class or multi-asset fund, is a combination of asset classes (such as cash, equity or bonds) used as an investment. A multi-asset class investment contains more than one asset class, thus creating a group or portfolio of assets. The weights and types of classes vary according to the individual investor’ – https://www.investopedia.com/terms/m/multiasset_class.asp
- All funds in the Mixed Investment 0-35% Shares, 20-60% Shares and 40-85% Shares are included – https://www.theia.org/industry-data/fund-sectors/definitions
- Quartile definition: “A statistical term that describes a division of observations into four defined intervals based on the values of the data and how they compare to the entire set of observations.” – https://www.investopedia.com/terms/q/quartile.asp
- https://www.onthisday.com
Foster Denovo Private Wealth is a trading name of Foster Denovo Limited, which is authorised and regulated by the Financial Conduct Authority Registration No: 462728.
Registered office: Foster Denovo Limited, Ruxley House, 2 Hamm Moor Lane, Addlestone, Surrey, KT15 2SA.
Phone: 01932 870 720 Email: info@fosterdenovo.com Website: www.fosterdenovo.com | PCMB53220523